
Scalability Testing for AI Agents: Best Practices

An AI agent can stay online and still fail. Under load, response time can jump, answer quality can drop by 30%–40%, and token spend can spike by 11x in under four minutes.
If I were setting up scalability testing for an AI support agent, I’d focus on four things right away:
- Speed: track p95/p99 latency and Time to First Token
- Quality: watch hallucination rate and task completion
- Stability: monitor 429s, timeouts, and connection pool usage
- Cost: measure cost per conversation and cost per 1,000 messages
I’d also test the system the way people use it: multi-turn chats, tool calls, handoffs, and traffic spikes across webchat, WhatsApp, and SMS. That means running load tests, stress tests, spike tests, and then turning the results into release gates.
Here’s the short version:
- Set pass/fail targets before testing
- Use production-like prompts and turn delays
- Test peak traffic and 2x peak
- Track quality during load, not just uptime
- Check handoff paths under pressure
- Keep about 20% headroom below the break point
- Re-test after prompt, model, workflow, or infra changes
A simple rule: if your AI gets slower, starts making things up, or blocks human handoff during a traffic jump, it has a scale problem even if the dashboard says it’s fine.
Below, I’d walk through the main practices, thresholds, and test patterns that help catch that problem early.
AI Agents 8 - Evaluation, Cost and Scalability
sbb-itb-e1b05dc
Why Scalability Testing Matters for AI Support Teams
AI agents don't break the way older systems do. When a standard IVR reaches its limit, it usually goes quiet or drops the call. That's easy to spot. AI agents are trickier. They can stay online while hallucinating, sending users to the wrong place, or returning bad data, and the dashboard can still look fine [7].
That gap is the problem.
Research shows that under heavy load, multi-turn conversations can degrade by 30–40%, while latency climbs in a nonlinear way as concurrency goes up [7][1]. So scalability testing can't just check whether the system stays up. It also has to check whether the system stays right under pressure.
Launch days, outages, and holiday traffic don't all stress the same part of the stack. One surge might hit rate limits. Another might push longer prompts through the model, which slows inference and can lead to shorter, less reliable replies. In other cases, connection exhaustion becomes the bottleneck and blocks escalations altogether.
Cost is another place where things can get ugly fast. One unoptimized agent can see token costs jump 11x in under four minutes when a batch of requests lands at the same time [4]. And when long-running sessions keep database connections open, teams can run out of available connections for human handoffs. At that point, new escalation requests start queueing or timing out, and customers lose their path to a live agent [3][5].
Most failures show up in a handful of patterns:
| Failure Mode | What It Looks Like | Business Impact |
|---|---|---|
| Latency spikes | Responses slow past the one-second threshold | High abandonment; degraded CX [7] |
| Silent hallucinations | AI invents policies or gives wrong info | Compliance risk; misinformation [7] |
| Rate limiting | 429/502 errors from LLM providers | Full service outage during peaks [3] |
| Connection pool exhaustion | Escalations queue or time out | Failed human handoffs; system hangs [3][5] |
| Cost drift | Token usage spikes unexpectedly | Budget overruns during surges [4] |
The next step is to track the metrics that surface these issues before customers do.
Core Scalability Metrics to Track
Set pass/fail thresholds before you start testing.
Latency is usually the first thing people notice. But averages can be misleading because they hide the slow tail. That’s why you need to track p95 and p99 response times - the slowest 5% and 1% of requests. For synchronous conversational agents, a common production target is p95 under 10 seconds. If responses stream, Time to First Token (TTFT) should stay under 2 seconds [10][5].
Throughput is usually measured in Tokens Per Minute (TPM). Track TPM closely, and keep an eye on RPM too, especially when tool-heavy turns lead to more provider calls [9]. You should also watch concurrent active conversations, which means the number of live, stateful sessions running at the same time [9][5].
Reliability and quality metrics help you catch failure modes that simple monitoring often misses. Track error rates, timeout rates, and 429s, along with hallucination and task-completion rates. A common target is an overall error rate below 1%, hallucination rates under 3%, and task completion above 85% [5][7]. These numbers make it easier to spot latency, quality, rate-limit, and cost issues that show up under load.
Baseline these metrics before any load run:
| Metric Category | What to Measure | Target / Threshold |
|---|---|---|
| Latency | p95, p99, TTFT | p95 < 10s (sync); TTFT < 2s [10][5] |
| Throughput | Tokens Per Minute (TPM), RPM | Provider-specific; alert near 70–85% of capacity [9] |
| Reliability | Error rate, timeout rate, 429 rate | Error rate < 1%; alert if 429s exceed 1% [5][9] |
| Quality | Hallucination rate, task completion rate | < 3% hallucinations; > 85% completion [7] |
| Utilization | CPU/RAM, GPU memory, DB connection pool | Alert at 70–85% utilization [9] |
| Cost | USD per 1,000 requests, per conversation | Track drift and cost spikes [4] |
Track cost per conversation during every load test, not after deployment [4][5].
Once these baselines are in place, you can move on to testing traffic patterns and conversation flows that match how people will use the system.
1. Build Realistic Workload Models and Usage Scenarios
Start with the latency and throughput baselines above, then model traffic that looks like actual support activity. That means production traffic, not neat happy-path flows. Use 50–200 prompts pulled from production logs to cover intent, prompt length, and task complexity [4][8]. Those logs also show token growth and latency patterns that synthetic tests often miss.
As conversations get longer, prompts get bigger, and inference slows down [5][8][3]. To mirror how people use support systems in practice, add a 2–15 second pause between turns. Without that pause, you end up with a request stream that's far denser than normal user behavior.
You should also include tool calls and human handoffs. Under traffic spikes, those are often the first parts of the system to jam up [9][1][8].
Test at three load levels:
Many systems get traffic spikes of 2x to 5x their average volume [9]. So your peak scenario should reflect those surges, not a plain average day.
Also track cost per 1,000 messages at each load level, because growing context can push spend up fast [4].
Use these workload mixes to power the flow-level load tests that come next.
2. Run Structured Load Tests on Conversational Flows
Use the workload mix above to test the actual multi-turn paths users follow. That matters because each turn adds more context, which makes prompts larger and inference slower. On top of that, some tool calls or API triggers don’t happen until a user goes through a certain sequence of choices. Reuse the production prompts and the turn delays from your workload model, and add short pauses between turns so the test mirrors how people use the product in practice [3][10].
Use a step-load pattern, not a linear ramp. Hold each concurrency level steady for a few minutes, then move up to the next step. This makes it much easier to spot the exact point where GPU memory tops out. And that drop-off can hit like a brick wall. In one test, response times stayed steady at 20 concurrent requests, then shot from 5.1 seconds to 28+ seconds at 25 requests when inference fell back to CPU and latency spiked [6]. That’s the point where user-facing latency starts to hurt, and answer quality can start to fall apart too.
Track quality during every run, not just speed. Detection accuracy can drop a lot before latency shows any change at all [6]. For streaming agents, watch inter-token latency (ITL) too. As Harbor Software noted:
"Users notice ITL degradation (the text appears to 'stutter') long before they notice TTFT degradation, which makes ITL the more sensitive and user-relevant metric for streaming AI applications." [6]
Use the same thresholds in every run so your test results are easy to compare:
| Metric | Target (Baseline) | Target (Peak Load) | Investigation Trigger | Source |
|---|---|---|---|---|
| p95 Response Time | < 2 seconds | < 3 seconds | > 3x baseline | [2][5] |
| Error Rate | < 0.5% | < 1.0% | > 5% | [2][5] |
| Time to First Token (TTFT) | < 2 seconds | < 2 seconds | > 5 seconds | [5][10] |
After you find the steady-state cliff, test what happens when traffic spikes all at once.
3. Run Stress and Spike Tests for Extreme Scenarios
Once steady-state load testing is done, push the system harder with stress and spike tests. The goal is simple: find the first way it fails when demand jumps.
Focus on three test profiles:
- Ramp to find the first point where performance starts to slip
- Spike to expose cold starts and rate limits
- Sustained load to surface memory leaks and connection pool exhaustion [3]
Don’t test concurrency alone. Test conversation complexity too. An agent can stay online and still fail in a way that matters, like hallucinating or giving the wrong answer [7]. That’s why quality metrics need to run side by side with latency and error rates in every stress test.
Also track cost per 1,000 messages at each concurrency level. This shows when scaling starts to cost too much. If cost per 1,000 messages keeps climbing, traffic growth stops making business sense [5].
Use these tests to set hard thresholds for latency, quality, and cost:
| Metric | Target Threshold | Action Trigger |
|---|---|---|
| p95 Latency | Under 15 seconds [5] | Above 15 seconds [5] |
| Time to First Token | Under 2.0 seconds [5] | Above 2.0 seconds [5] |
| Error Rate (timeouts, tool errors) | Under 1% [5] | Above 1% [5] |
| Hallucination Rate | Under 3% [7] | Above 3% [7] |
| Successful task completion | Above 85% [7] | Below 85% [7] |
By stress-testing each rollout phase, Glovo scaled from 1 AI agent to 80 in 12 weeks, improving uptime 5x and customer inquiry deflection 35% [7].
Those thresholds show how much headroom load balancing and horizontal scaling need to deliver.
4. Use Load Balancing and Horizontal Scaling
Once your thresholds show where capacity starts to crack, scale the layer that fails first. For AI agents, that usually means splitting connection handling, routing, and worker pools so each part can grow on its own based on the bottleneck you found in testing. A central queue like Redis or NATS helps separate workers and cut contention.
A common starting point is 2,000–3,000 WebSocket connections per pod [5]. As connection counts climb, you add more pods. But here’s the catch: GPU queue saturation can hit first, even when connection numbers still look fine. An H100 PCIe (80GB) can support 100+ concurrent 7B-model sessions at a 4K context window before VRAM fills up [8]. That’s why you want to scale before utilization falls off a cliff.
Use the point where load tests start to flatten as your signal to add pods. A practical rule is to scale when GPU utilization reaches 85% or KV cache usage reaches 80%, whichever happens first [8]. KEDA can help here by scaling from queue depth instead of CPU alone, and it can scale down to zero during idle periods [12]. For critical roles, keep a small pool of warm replicas so traffic spikes don’t get stuck waiting for startup.
Cost matters too. Track infrastructure cost per 1,000 messages because LLM calls still drive most spend [5]. Route simple requests to lighter models, and save larger models for harder tasks. For low-priority jobs, Spot capacity can cut compute cost [12].
To protect p95 and p99 response times, put two guardrails in place:
- Store session state outside the worker, and use sticky sessions so reconnecting clients land on the same pod [5][12]
- Add circuit breakers around LLM calls and tool execution so one slow dependency doesn’t drag down the full system [5][8]
Without those controls, p99 latency can spike because of slow providers and long tool chains [3]. These are the basics for using inference resources well.
5. Allocate Resources Efficiently for AI Inference Workloads
After horizontal scaling, size your GPU, CPU, and memory based on the bottleneck your load tests exposed. That result should drive the decision: add more GPU, more CPU, or more memory headroom. The goal is simple: match capacity to the load your agents actually handle, not the load you assume they will.
Concurrent Conversations Handled
GPU VRAM sets the hard limit for concurrency. KV cache grows as context length and batch size increase. When VRAM is exhausted, you can hit OOM errors or see nasty latency spikes [8].
CPU limits can slow things down even when the GPU still has room left. That happens because orchestration, retrieval, parsing, and tool calls often carry a big share of the load [11].
Once you know your concurrency limits, test latency and saturation under that same load. Otherwise, it's easy to think the system is fine when it's only fine on paper.
Latency and Saturation Signals
Use p95 TTFT and p95 ITL as allocation guardrails, then check them against gpu_sm_utilization, gpu_memory_used, and kv_cache_usage_percent [8][13]. Those metrics help you see whether slowdowns come from compute pressure, memory pressure, or KV cache growth.
The p99 LLM call can take 10x the median latency [3]. That's a huge gap. And it's why concurrency testing is the only dependable way to surface outliers before they show up in production.
Error and Timeout Rate
Split 429s from 500/504s so you can tell provider quota limits from infrastructure failures [8][10]. If you lump them together, you lose the signal you need.
It also helps to keep 30% to 50% headroom above projected peak traffic. That buffer gives you room for bursts and retry traffic without tripping rate limits [9].
Infrastructure Cost per 1,000 Messages
Once capacity is stable, shift attention to spend by routing work to the right model tier. Model tiering means sending simple tasks, like classification and summarization, to cheaper, faster models, while saving higher-tier models for complex reasoning. Done well, this can cut total costs by 40% to 60% [5].
You can also use an inference router to lower cost without changing code [11]. That makes cost control a lot less painful, especially when traffic patterns change.
6. Set Up Observability and Monitoring
After you right-size resources, the next step is to instrument the stack so load tests show bottlenecks before users run into them. Watch three layers: request, model, and infrastructure. That gives you a simple map for comparing load-test results across each layer and spotting where things start to break. The point isn’t just uptime. It’s knowing which layer gives out first as concurrency climbs.
Active Sessions and Connections
Track active sessions and WebSocket connections in real time. As concurrent sessions go up, look for the inflection point - the load level where p95 and p99 latencies start spiking hard instead of creeping up little by little. That inflection point is your concurrency ceiling [1][8].
p95/p99 Response Time
Use p95 for SLA reporting and p99 for alerting. The tail usually shows saturation first.
For streaming, keep Inter-Token Latency (ITL) at p95 < 50 ms. Once it goes above 100 ms, responses start to feel jittery to users [8].
Error and Timeout Rate
Split 429s from 5xxs. A 429 points to provider rate limits, while a 5xx points to infrastructure failure. Same symptom on the surface, very different fix underneath.
Also watch x-ratelimit-remaining headers from your LLM provider so you can catch throttling before it starts turning into user-facing errors [3].
Once these signals are visible, run the same load patterns across each channel and handoff path.
Infrastructure Cost per 1,000 Messages
Track cost at a few concurrency levels, such as 10, 50, and 100 concurrent users, to spot the point where batching losses or cache misses push unit cost up [8]. As concurrency rises, unit cost climbs when throughput drops. If that cost curve bends sharply upward before you reach your target load, that’s a sign the system isn’t scaling efficiently [1][8].
With observability in place, you can then check how these signals shift across webchat, WhatsApp, and SMS.
7. Test Multi-Channel Scalability Across Webchat, WhatsApp, and SMS
Once you have your baselines, test each channel against its own traffic pattern. Don’t treat webchat, WhatsApp, and SMS like they behave the same way. They don’t, and that’s where teams get blindsided.
Webchat usually runs on WebSocket or SSE-style bidirectional streaming. That means your setup needs to handle file descriptors and socket memory as concurrent users climb [5][1]. WhatsApp and SMS work differently. They send a single HTTP request per message, so pressure tends to show up around API limits and webhook queues. And when those queues start backing up, handoffs can slow down before the system shows any other warning sign [1][3].
Replay the full message sequence for each channel. Webchat, WhatsApp, and SMS tend to fail in different places, and that changes how you should load test them.
Measure latency, errors, and output quality separately for each channel. If you only look at one rolled-up view, you can miss slow paths. A p95 that looks fine at the top level can still hide a WhatsApp or SMS path running into provider rate limits, or a webchat path building socket pressure. Under heavy multi-channel load, LLMs can see a 30% to 40% performance degradation in multi-turn conversations [7]. So the system may still look “up” while the AI starts hallucinating or making up policies. Track those failure modes per channel, not just in one combined report.
Concurrent Conversations Handled
Don’t stop at your expected peak. Push load up to 2x your projected peak so you can find the actual breaking point [3]. AI agents can fall off a cliff once GPU queues fill up, so test for the point where quality drops, not just the point of outage.
Your concurrency ceiling is also limited by Tokens Per Minute (TPM), not just Requests Per Second (RPS). That needs to be part of your channel-by-channel simulations [9].
p95/p99 Response Time
Tail latency matters more than averages. As Ahmed Aleryani notes:
"The 99th percentile LLM call can be 10x the median. Without concurrency, you never see the tail. With concurrency, the tail dominates user experience." [3]
Run these measurements for each channel on its own, so a slower WhatsApp or SMS path doesn’t get buried inside an average that looks fine.
Infrastructure Cost per 1,000 Messages
Compare cost per 1,000 messages by channel and by context length, since AI cost scales with tokens, not just message count [8]. A simple routing setup can help here: use a cheaper model for basic classification, and save a more capable model for harder reasoning tasks. That can cut total costs by 40% to 60% [5].
Next, check that escalations and human handoffs still work under load.
8. Test Escalation Paths and Human Handoff Under Load
After you finish channel-level load tests, test escalations at peak traffic too.
This is where teams get fooled. Dashboards can look fine while escalation logic starts to crack under pressure. The AI may seem healthy, but the handoff path can still fall apart. And that’s the whole point here: AI may scale on paper while human handoff fails in practice. Every escalation needs to arrive complete, fast, and usable.
When an AI agent sends a case to a human, the full conversation history, customer metadata, and reasoning context need to come across intact. Aim for 100% context completeness in peak-load handoffs [14]. If that slips, agents are stuck working blind, and customers have to repeat themselves [14].
Concurrent Conversations Handled and Latency
Test handoff flows at 1.5x historical peak simultaneous volume [14]. Then watch for the break point: the concurrency level where latency jumps and handoff logic starts to fail [7][14]. That point gives you your actual capacity ceiling. After you find it, set your operating limit with a 20% safety margin below that threshold [7][14].
For escalation paths, tail latency matters most. If p95 response time goes above 2 seconds, that points to queue saturation or context overload [1][7]. For interactive chat, keep p95 Time to First Token under 500 ms [8].
It also helps to track context transfer latency as its own metric. This is the time needed to package and display conversation history for a human agent. If that step slows down, customers start repeating themselves, and overall handle time stretches out [14].
Error and Timeout Rate
High error rates in load tests can warn you about a handoff flood - a situation where failed AI interactions hit the human queue all at once [14]. Track these as separate metrics:
- Failed escalations per load test
- Handoff queue saturation
Your total error rate, including timeouts and tool failures, should stay under 1% [5][14].
Test the graceful degradation path on purpose too. When load reaches the limit, throttle AI concurrency and send new conversations straight to the human queue. Don’t keep serving weak AI responses under strain [7][14].
Use these handoff thresholds as regression gates for the next tuning cycle.
9. Tune Performance and Run Regression Tests Iteratively
Once your handoff paths hold up under peak load, turn those limits into regression tests. Then, after any change, run the same webchat, WhatsApp, and SMS workloads again to make sure the agent still scales the way it should. Do this for every release, not just the big ones.
Concurrent Conversations Handled
Any time you change the prompt, model, workflow, or infrastructure, rerun the same workload profile and check that the capacity ceiling hasn’t slipped. A staircase load test with fixed concurrency steps works well here because it shows you exactly where latency starts to fall off a cliff.
p95/p99 Response Time
Tail latency is what keeps live chat from feeling sluggish during each release. Use p95 as your release gate and p99 for alerts. For interactive chat, treat 500–2,000 ms as a degraded state. If response time goes above 5,000 ms, that should trigger autoscaling or load shedding.
To keep those thresholds in place, add a regression gate to your CI/CD pipeline. A test harness like PromptFoo or Braintrust can run a golden set of about 200 tagged test cases. Pair that with an LLM judge, and block the merge if the aggregate score drops by more than 2% [5].
Error and Timeout Rate
Keep total error rates below 1% [5]. Also, test 429 handling hard so you don’t end up with retry storms when traffic spikes.
Cost per 1,000 Messages
Tie cost regression to the same customer-facing flows people use, not just to abstract infrastructure metrics. Track cost per 1,000 messages by combining token usage with self-hosted GPU-hour costs, then add 10–20% for compute, Redis, and networking.
Every tuning cycle should check cost right alongside latency. That way, you’re not making the system faster while quietly driving up spend.
Use the stabilized capacity ceiling as the basis for capacity planning and rollout limits.
10. Plan Capacity and Rollout Strategies for Growth
Use the regression ceiling to set rollout limits. That gives you a simple call at each stage: expand, pause, or roll back.
Concurrent Conversations Handled
You can estimate concurrency from TPM, average tokens per run, and average run time:
concurrent_runs = TPM_limit / (avg_input_tokens + avg_output_tokens) * 60 / avg_run_seconds [9]
A single instance often handles 10 to 50 concurrent users before latency starts to slip [15]. Use your result as a guardrail for rollout and capacity planning.
When projected peak demand reaches 70% of your current tier limit, file for a quota increase [9]. Don’t wait until the last minute. Make sure the higher tier is active before you cross 90% [9].
Rollout Gates for Latency and Errors
Use test data to define three operating modes, then tie each one to TTFT and error rate.
| Operating Mode | Error Rate | TTFT | Action |
|---|---|---|---|
| Normal - expand | < 0.1% | p95 < 500ms | Safe to expand [8] |
| Degraded - pause | ~1.0% | p95 500ms–2,000ms | Pause expansion; investigate [8] |
| Breach - roll back | > 1.0% | p99 > 5,000ms | Rollback or load shedding [8] |
Set horizontal autoscaling triggers near the top of the Normal range, not at the edge of Degraded. That buffer matters. It gives you about 10% to 15% headroom before users start to feel the slowdown [8].
Infrastructure Cost per 1,000 Messages
At scale, cost can become the thing that stops rollout even if latency still looks fine. At 10,000 concurrent users, LLM API costs alone are estimated at $200 to $500 per hour [5].
There are two plain ways to cut that bill:
- Keep each session on the same backend
- Cache prompts when you can
Done well, those steps can reduce API cost by 50% to 90% [15].
These gates help you tell the difference between steady capacity and failure under load, stress, or traffic spikes.
Load Testing vs. Stress Testing vs. Spike Testing
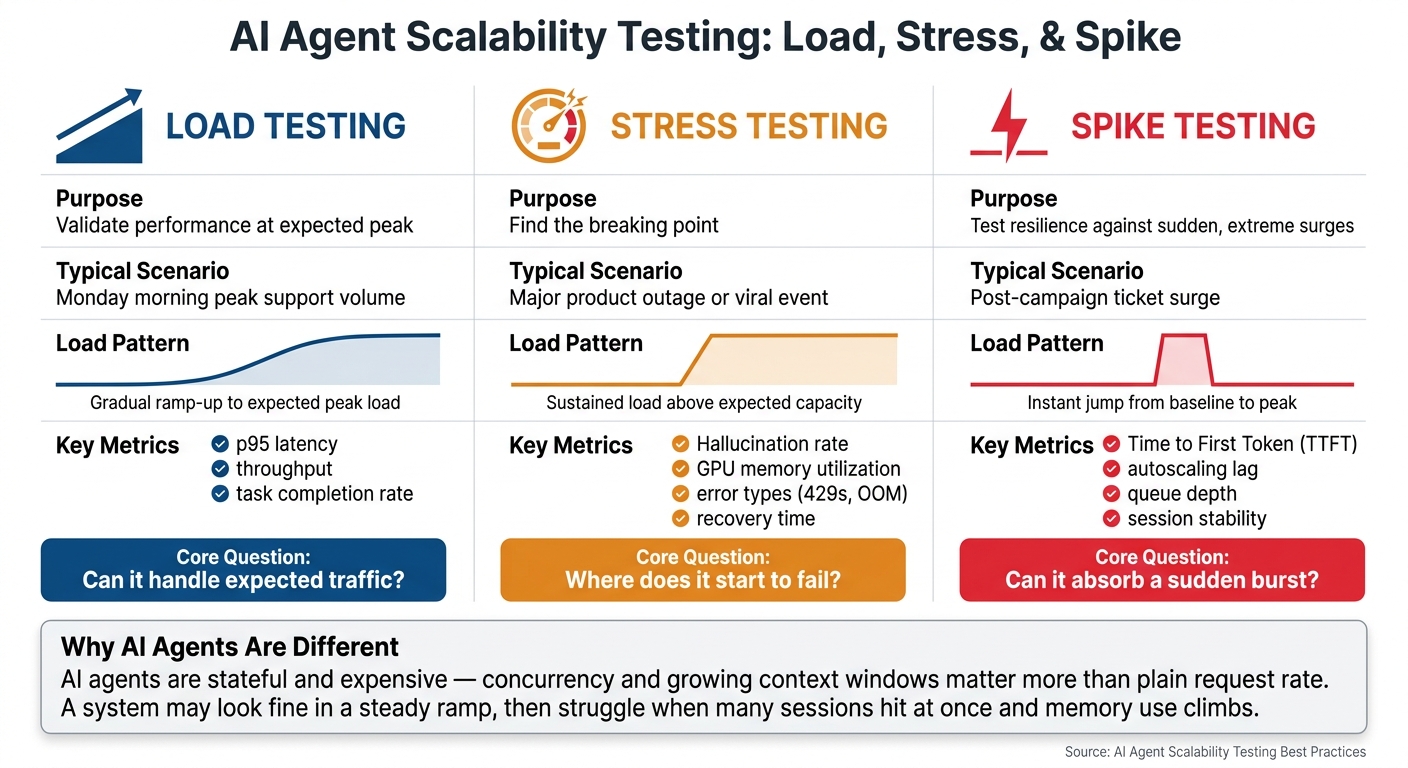
AI Agent Scalability Testing: Load vs. Stress vs. Spike Tests Explained
Use p95 latency, TTFT, error rate, and task completion in different ways across load, stress, and spike tests. These test types get mixed up all the time, but they answer different questions. Pick the wrong one, and you can miss weak spots until production.
Each test answers a different capacity question.
| Test Type | Purpose | Typical Helpdesk Scenario | Load Pattern | Key Metrics |
|---|---|---|---|---|
| Load Testing | Validate performance at expected peak | Monday morning peak support volume | Gradual ramp-up to expected peak load | p95 latency, throughput, task completion rate |
| Stress Testing | Find the breaking point | Preparing for a major product outage or viral event | Sustained load above expected capacity | Hallucination rate, GPU memory utilization, error types (429s, OOM), recovery time |
| Spike Testing | Test resilience against sudden, extreme surges | A post-campaign ticket surge | Instant jump from baseline to peak | Time to First Token (TTFT), autoscaling lag, queue depth, session stability |
Here’s the simple way to think about it:
- Load testing checks whether the system can handle the traffic you expect.
- Stress testing shows where it starts to fail and how it behaves under pressure.
- Spike testing checks whether it can absorb a sudden surge without falling apart.
For AI agents, that difference matters a lot. These systems are stateful and expensive to run, so concurrency and growing context windows usually matter more than plain request rate. A system might look fine in a steady ramp, then struggle when many sessions hit at once and memory use climbs.
Spike tests, in particular, should check whether autoscaling and queuing react fast enough to stop session collapse. If TTFT jumps, queues pile up, or sessions start dropping, that’s a warning sign that the system can’t absorb a sharp burst cleanly.
Use the failure point from each test to set pod counts, GPU headroom, and autoscaling thresholds in the next step.
How Converso Supports Scalable AI Helpdesk Operations
For Converso, these tests check how support works when traffic gets heavy across webchat, WhatsApp, and SMS. Because Converso runs AI agents across all three channels inside one conversation context, load can pile up in more than one place at the same time.
The first stress point is usually human handoff. When load spikes, long-running AI requests can burn through database connection pools. That can slow down escalations to human agents or block them altogether if connection use isn't handled with care [3]. Session affinity also matters here. It helps reconnecting users return to the same pod, which cuts extra latency [5].
Converso also has to deal with multiple workspaces and inboxes. If one workspace gets hit by a traffic spike, it can act like a noisy neighbor and drag down performance for other teams. That tends to happen when shared resources - like database connection pools or Redis memory - aren't split up and watched closely.
These checks make scalability a release gate, not just an idea.
Conclusion
Scalability testing isn’t a one-time launch task. It’s a continuous habit. As traffic grows, channels expand, and automation gets layered in, these tests help teams spot failure early. And with AI agents, uptime alone isn’t enough. A system can stay online while answer quality slips, so scale testing needs to guard both availability and response quality.
That only matters if the process protects latency, quality, and handoff reliability under load. The core metrics don’t change. Use the same latency, error, hallucination, and handoff metrics from the earlier sections as your release gate. Track quality failure thresholds just as closely as uptime, including the point where hallucination rates go above 3% or task completion drops below 85%. [7]
Then make those thresholds part of a recurring release gate. Run:
- Weekly regression tests
- Monthly capacity tests
- A new baseline after any major infrastructure, integration, or logic change
Treat these checks as part of load testing, stress testing, and regression testing, not as separate work. Set operating caps about 20% below the measured breaking point so the system has room to handle spikes. [7]
Make scalability testing part of every release. Teams that test on a steady cadence are far more likely to stay reliable when real demand hits.
FAQs
How often should AI scalability tests run?
Run scalability tests before you move AI agents into production. Then run them again any time the system setup changes or you’re getting ready to handle more traffic.
For reliability, take a progressive approach. Start with a baseline. Then increase load until you reach your expected peak. After that, push the system harder to find where it starts to fail.
Review the results on a regular basis so you can spot bottlenecks early, like rate-limit exhaustion or memory leaks, before users run into them.
What usually breaks first under load?
Under load, AI agent systems tend to break in the same few places first:
- Database connection pools run out
- LLM provider rate limits kick in and cause 429 errors or longer queues
- Redis memory pressure and tail-latency spikes get worse fast
A lot of the slowdown comes from long-running agent tasks. Unlike standard web requests, they often hold connections open for much longer, which puts extra strain on the system.
How do I test AI quality at scale?
Test AI quality at scale by running realistic, multi-turn conversations instead of judging the system only on simple request-response checks. Start with a baseline. Then push concurrency from normal traffic to peak load and, after that, to stress levels so you can see where things start to crack.
Keep the spotlight on quality, reasoning, and bottlenecks. Look through sample outputs during peak load, run harder back-and-forth exchanges with varied prompts and built-in think time, and watch for trouble spots like API rate limits, memory growth, queue depth, and token costs.



.svg)
.svg)
.svg)
.svg)